
With some minor price adjustments to the downside seen in Bitcoin over the last 48 hours, the alt market was once again painted in red.
However, the technical indicators for Bitcoin while showing little price recovery progress, maintained mixed signals on volatility and price action. While the short-term trend for Tron and Compound continued to remain bearish.
Bitcoin [BTC]
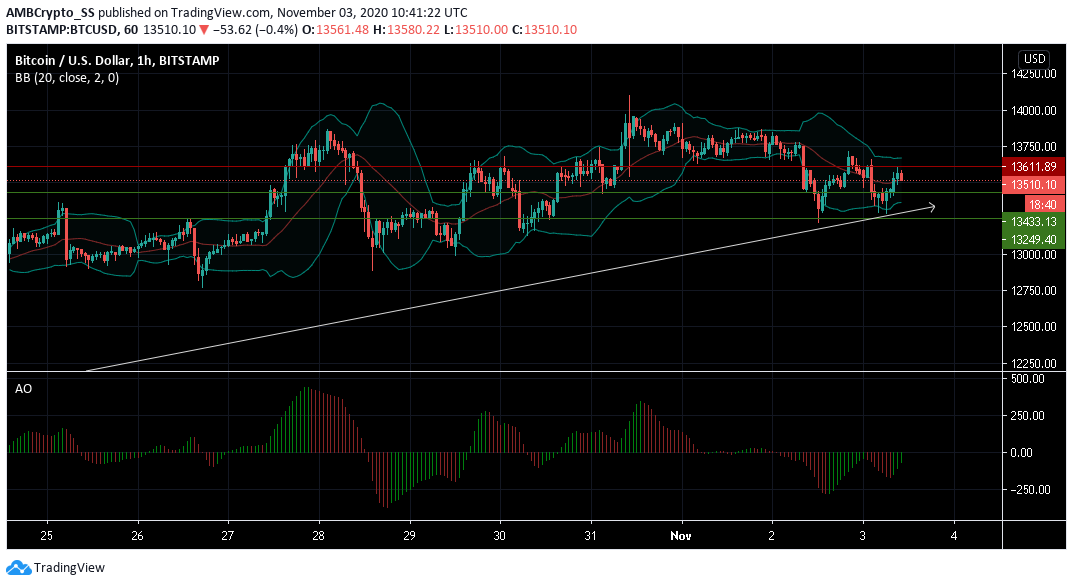
Source: BTC/USD on TradingView
At press time Bitcoin was last traded at $13,433. BTC recorded a momentary loss of less than a percent over the last 48 hours, which also influenced the bearish activity seen on most of the altcoins charts today.
The Awesome oscillator after recording some selling pressure, started to display a trend reversal with green closing bars below the zero line, an indication of weakening selling pressure.
Further, the hint of convergence noted in the Bollinger Bands, suggested some reduction in the volatility levels for Bitcoin, meaning the short-term trend was likely to maintain within the $13,550 and $13,450 price range.
Tron [TRX]
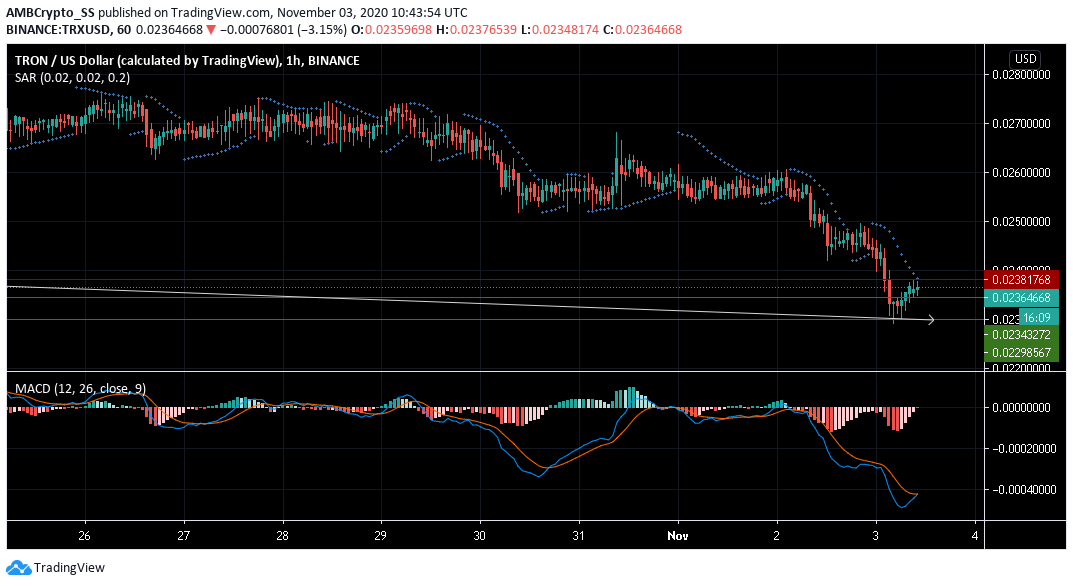
Source: TRX/USD on TradingView
Ranked 16th on messari.io with a market capitalization of almost $ 1.6 billion, Tron at press time was trading at $0.236
The digital asset has seen a price correction of nearly 10% over the last week, following the consistent sell-off period since the beginning of November.
The price fell below the $0.250 pivot level and thereafter another key resistance level at $0.0238, this short-term loss also coincided with a bearish crossover seen in MACD, signaling a bearish market momentum.
The placement of the dotted lines of the Parabolic SAR, above the candles, also indicated that the price could further go south, to retest the immediate support level at $0.023
Compound [COMP]
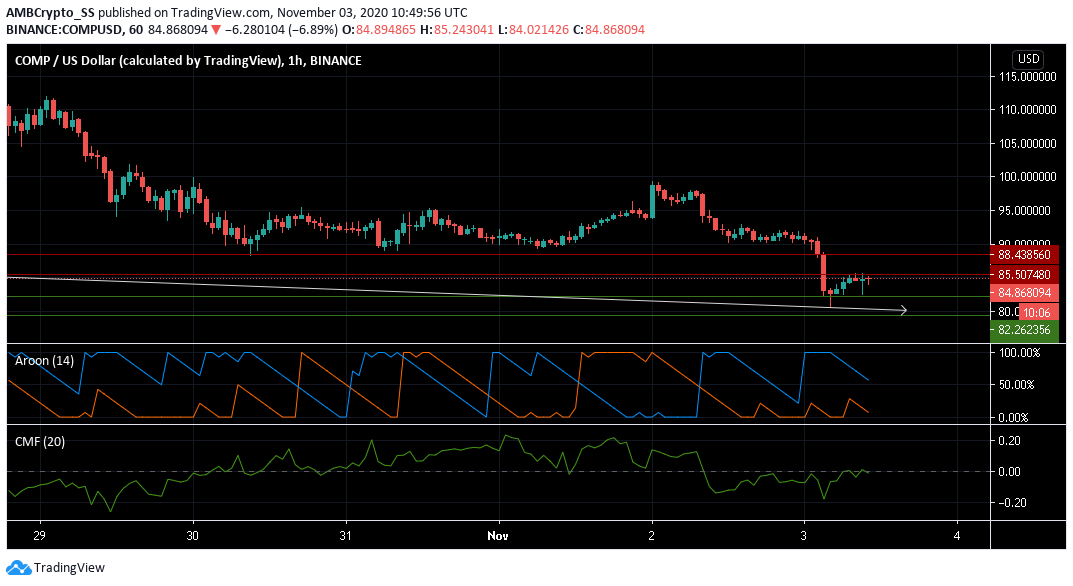
Source: COMP/USD on TradingView
Unable to steer clear of the first major resistance level at $88.438, Compound dropped from a high of $97 over the last 24 hours recording almost 8% in losses. The last traded price at the time of writing was $84.868.
The Aroon Indicator painted a clear bearish picture, with the Aroon down (blue) above the Aroon Up (orange).
The Chaikin Money Flow indicator still underlined a slightly negative level of capital inflows and could be seen maintaining a neutral view along the zero level, in the upcoming trading sessions.
A retest at the immediate support level could signal further bearishness in the COMP market for the coming days.


