

- Ethereum price has broken above a critical resistance barrier at $463.
- There seems to be almost no resistance for Ethereum until $500.
Ethereum price topped out at $468 on November 7 and seemed to form a potential double top on November 11 after hitting $466, followed by a slight rejection. However, in the past four hours, the digital asset has seen a notable breakout towards $474, negating the possible double top pattern.
ETH bulls face very little opposition to the upside
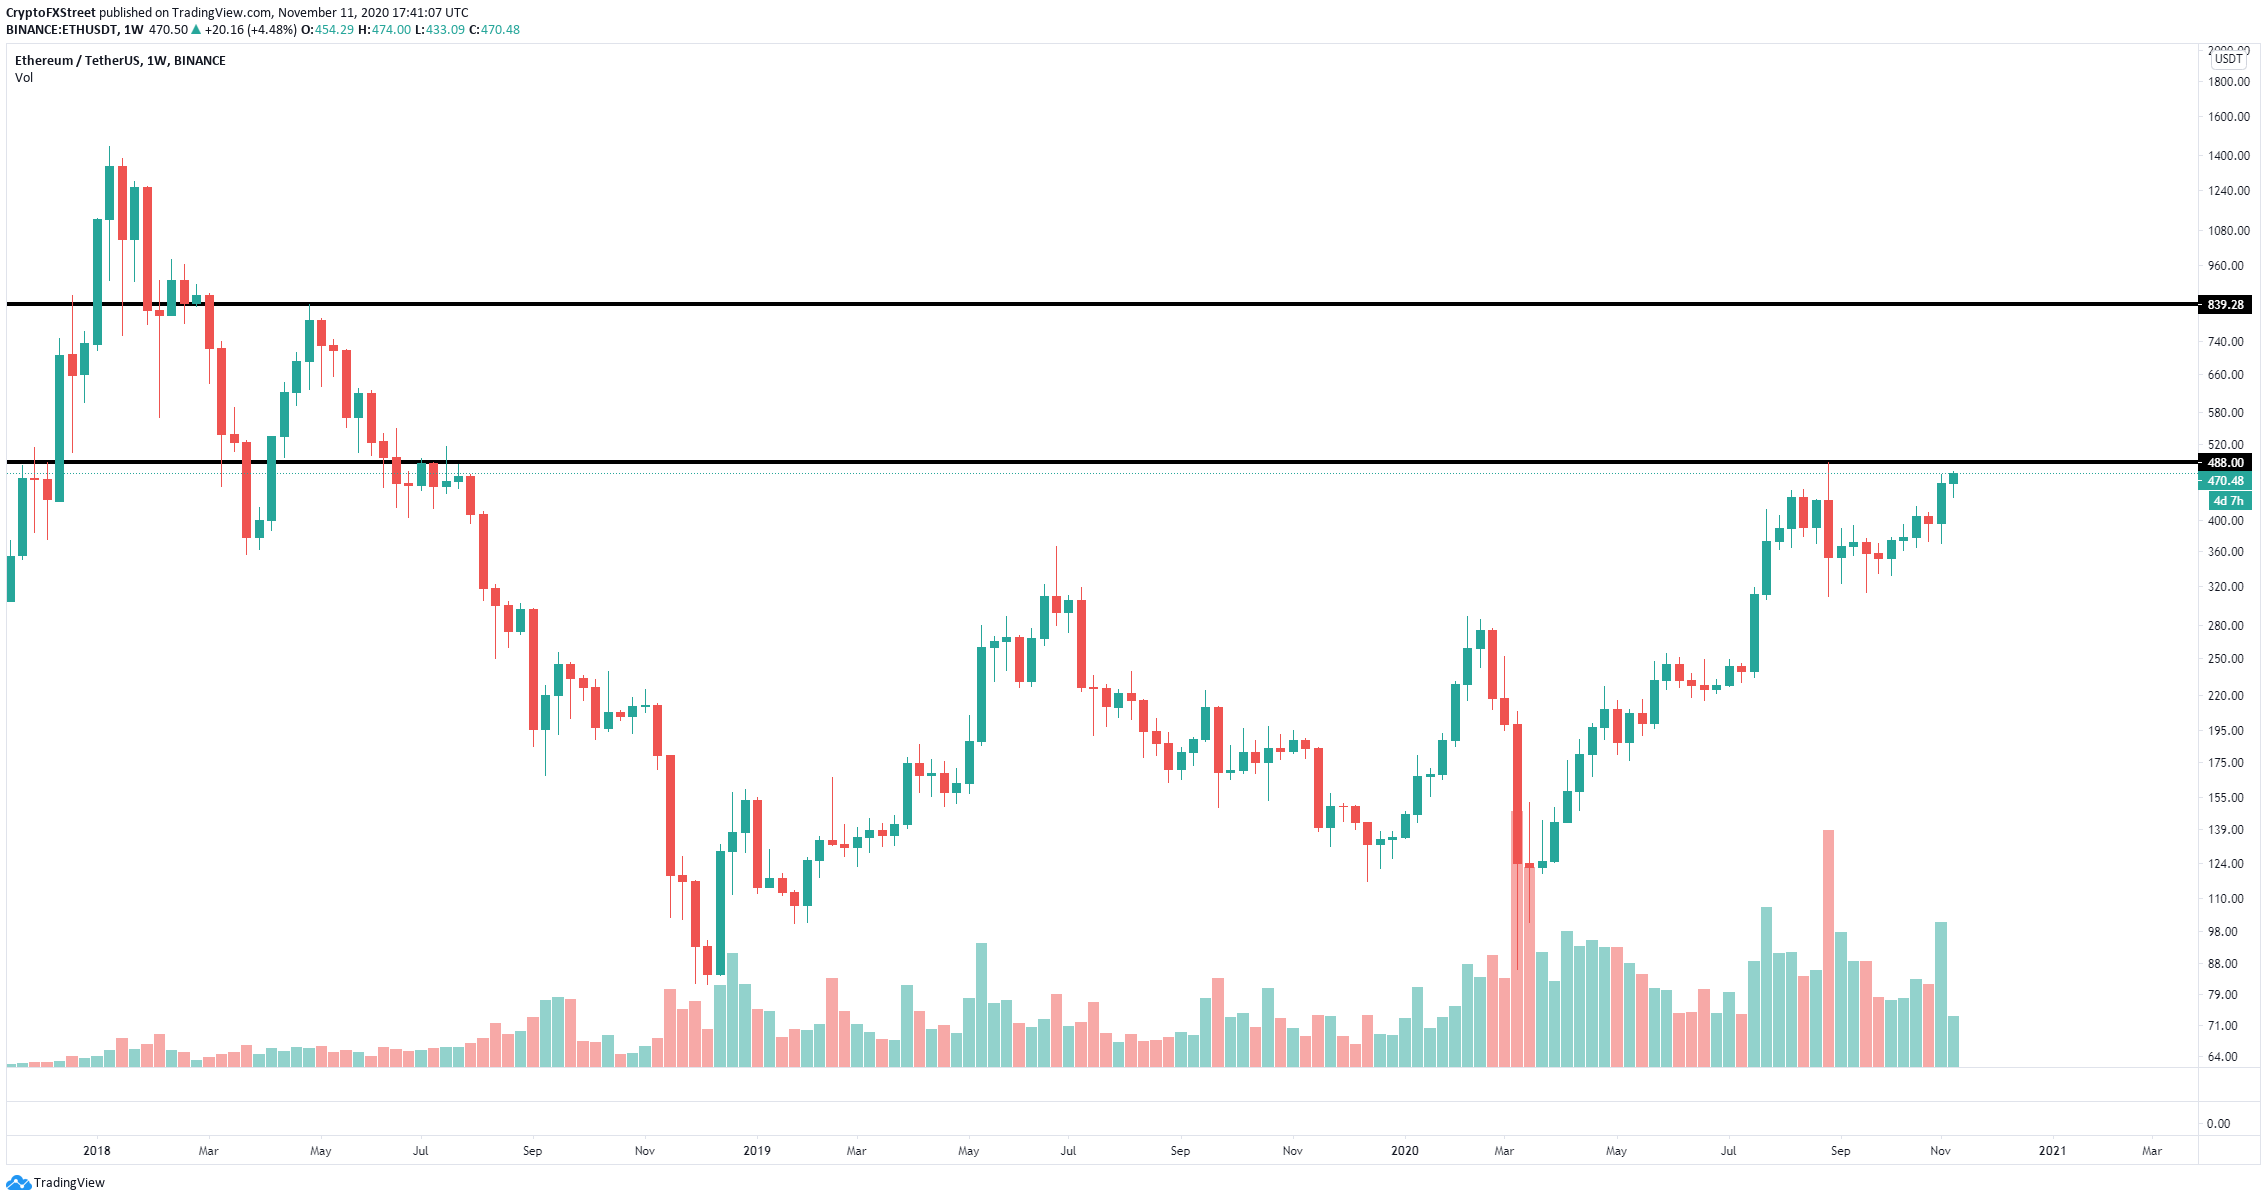
The next significant barrier seems to be established on the weekly chart at $488, which is the 2020 high formed on September 1. A breakout above this point could easily drive Ethereum towards $841.
ETH/USD weekly chart
Ethereum price is inside a weekly uptrend, just like on the lower time frames. On the 4-hour chart, ETH broke out of a symmetrical triangle pattern, which gives a price target of $488, precisely the high of 2020.
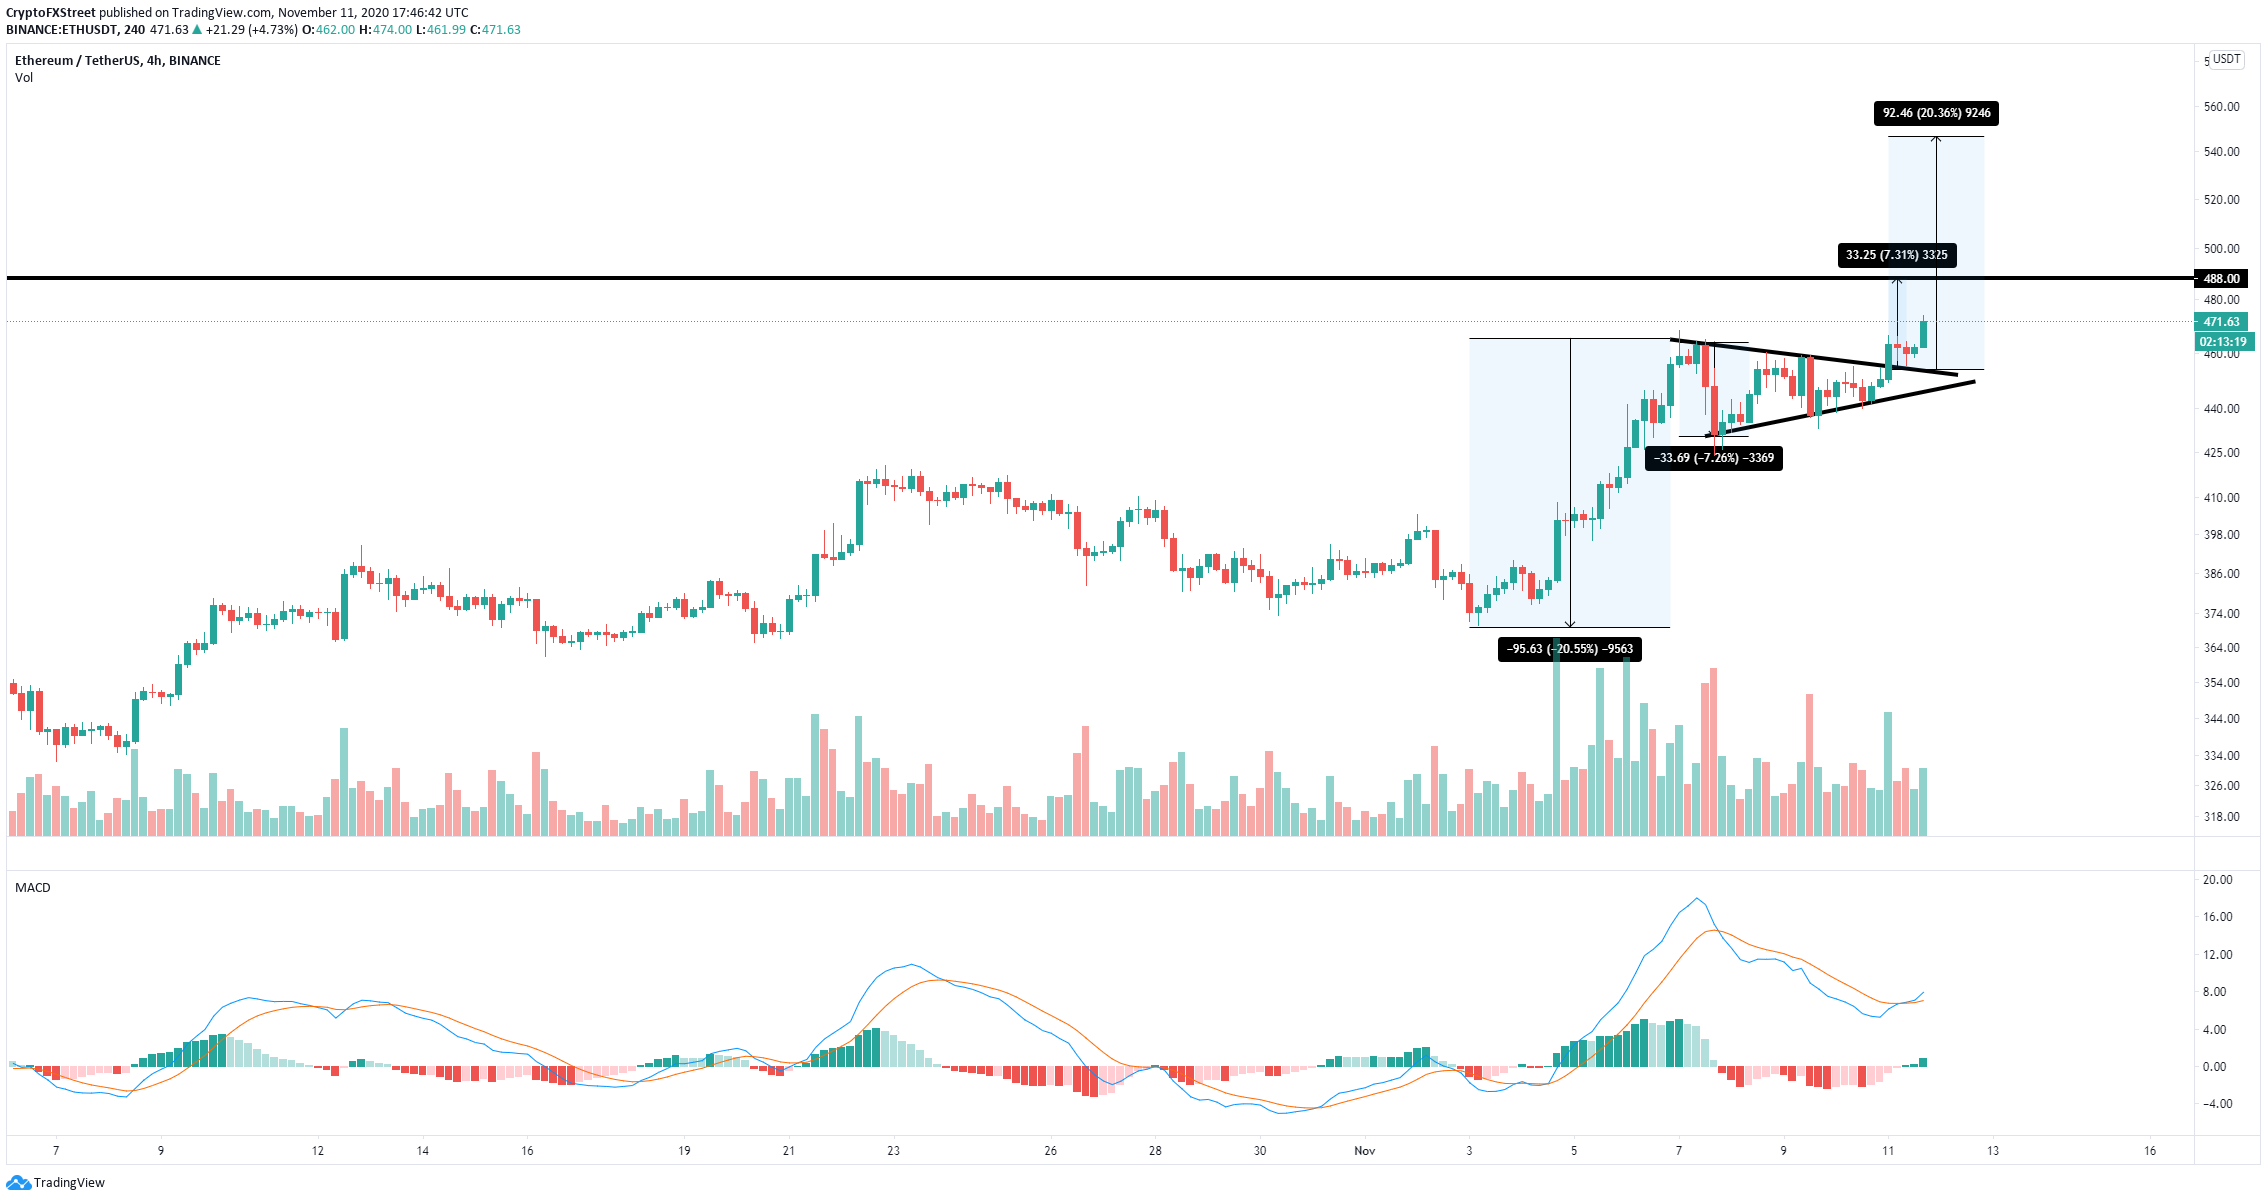
ETH/USD 4-hour chart
The MACD has also turned bullish for the first time since November 4, which was followed by a 20% price explosion. A similar move would create a price target at $546, especially if Ethereum price can break $488.
However, rejection from the critical resistance barrier at $488 would form a potential double top and would likely drive Ethereum price towards $450 to re-test the upper boundary of the triangle pattern on the 4-hour chart.


